SCOTLAND AND THE TWENTIETH CENTURY
Despite huge changes in the role of Government spending throughout the 20th century, largely from funding the military and national debt, to the funding of the welfare system and the NHS, the consensus of opinion from economists and historians alike is that Scotland has benefited from fiscal transfers due to being part of the UK during this period.
This article collates and presents the available data sources and looks further into this position. For example, the conclusions by T.M Devine and G.C. Peden in the 'Transformation of Scotland - The economy since 1700' [1] state:
'From the early 1920s identifiable public expenditure per head in Scotland was higher than England and Wales, and apart from a period in the 1980s when tax revenues were high, Scotland benefited from net fiscal transfers within the UK'
Gavin McCrone, in his 1999 paper ' Scotland's public finances from Goschen to Barnett ' [2] , has also stated that all academic studies that have analysed the numbers, 'show locally identifiable public expenditure per head in Scotland well above the average for the UK; and, therefore, even more above the average for England'.
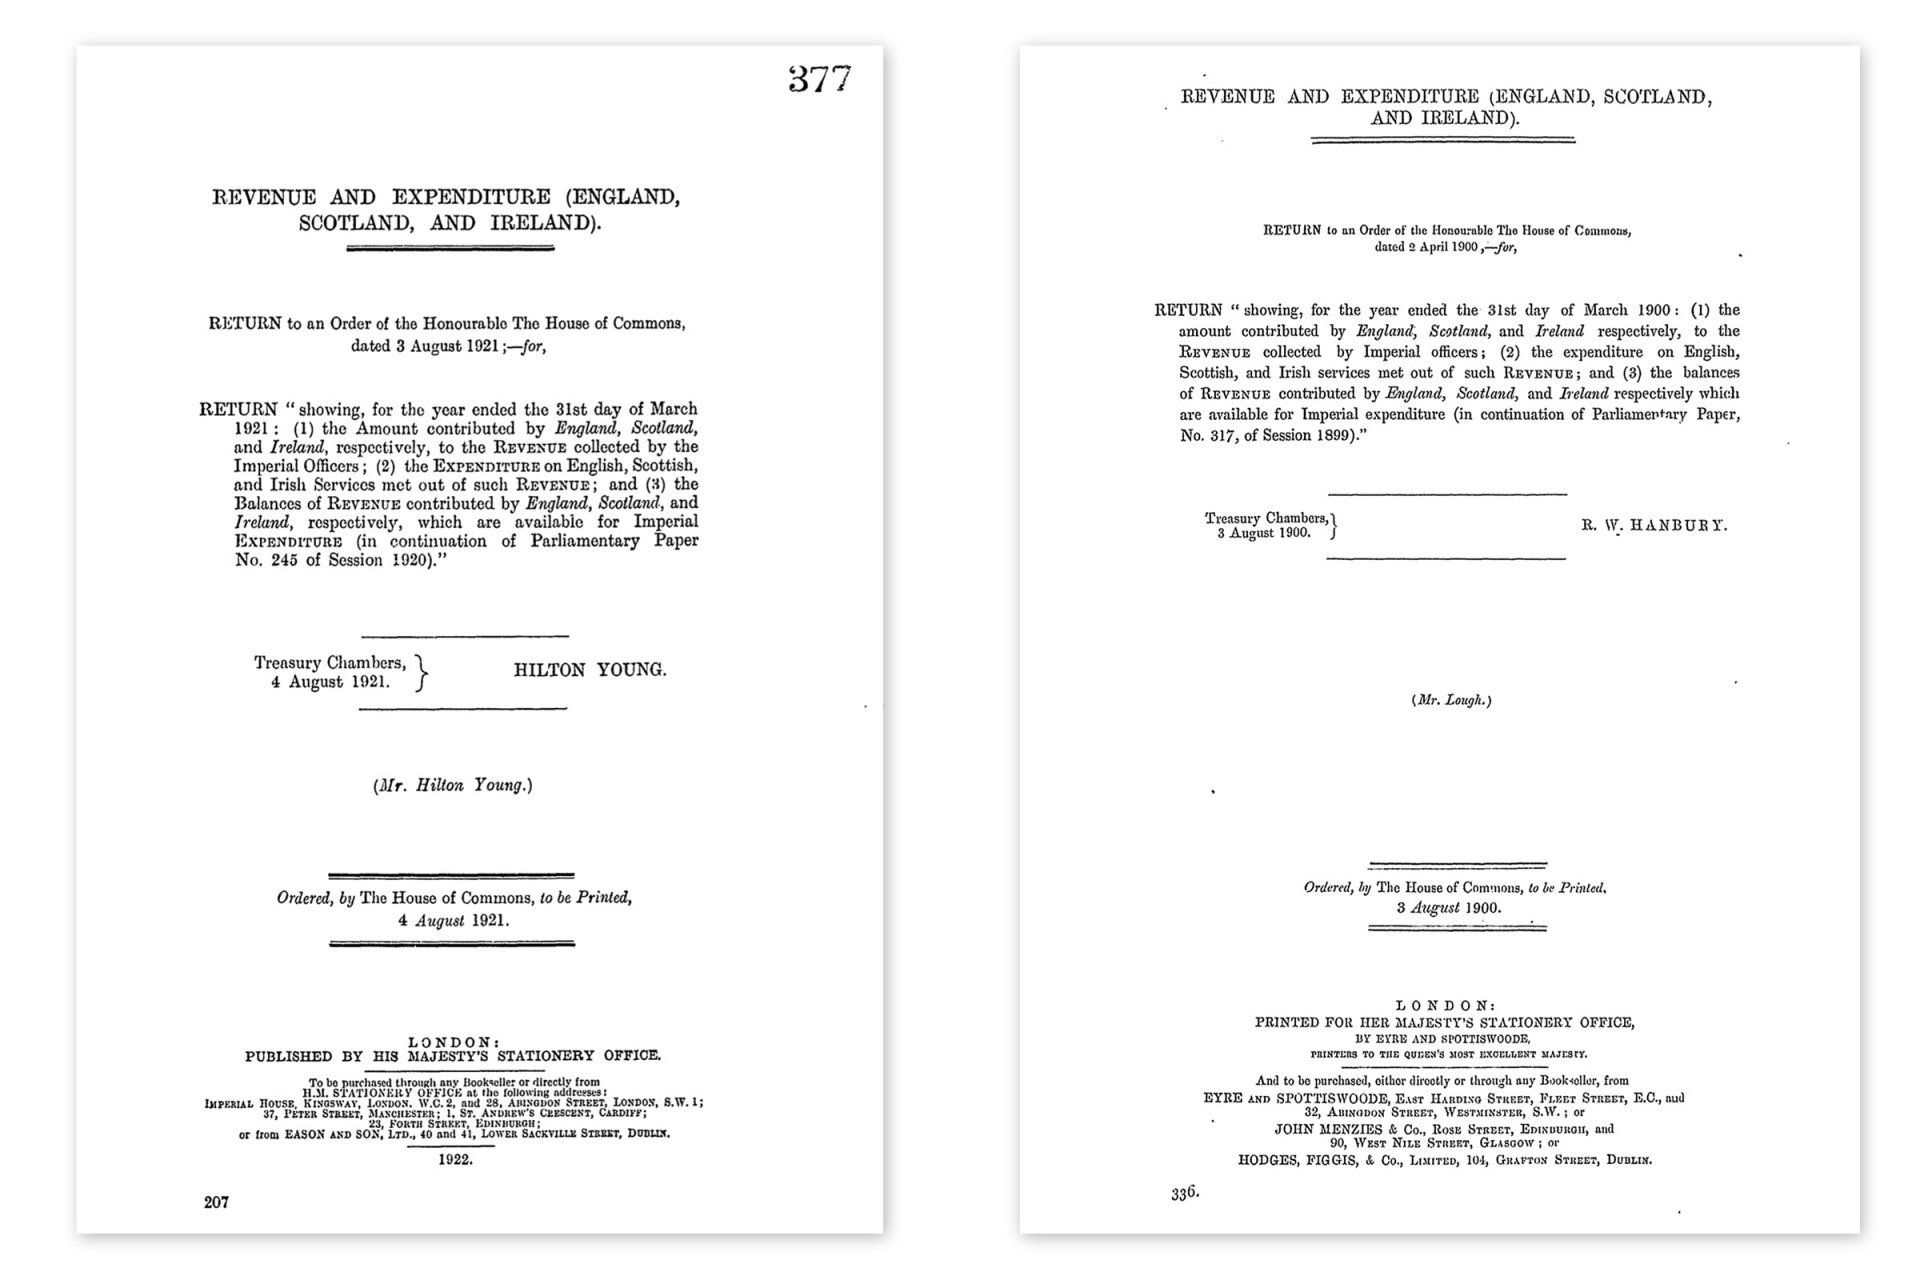
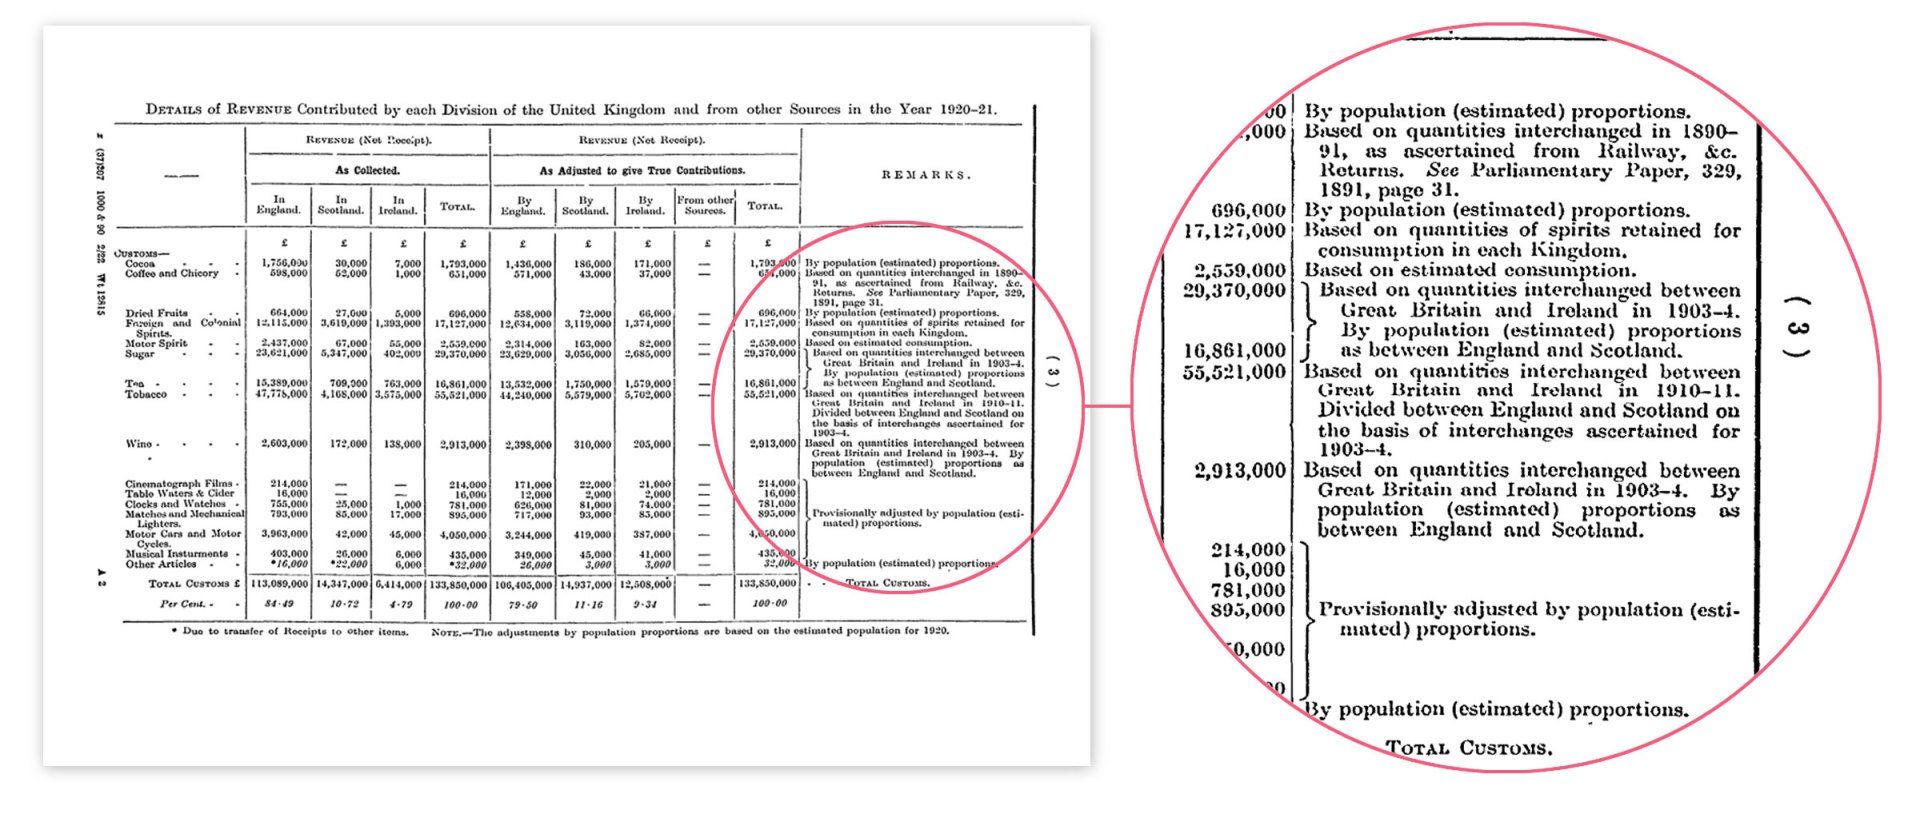
- Customs (Import Taxes) alone made up for 18% of 1899-1900's revenue, largely fueled by the UK's insatiable appetite for tea, tobacco and foreign spirits.
- Excise duties are made up of taxes on the UK production and sale of certain goods such as whisky and beer. These netted the exchequer 25% of all revenue.
- Estate Duty was imposed on inheritance of land and other properties. This was, remarkably, responsible for 11% of all government income, compared to just under 1% for 2016-2017.
- The remainder of government tax income was made up of Stamp Duty, Land Taxes and House Duty.
- The Navy and the Military, alone, accounted for 48% of all government spending.
- The national debt accounted for a further 16%.
- Running the post office amounted to 9%, while facilitating the collection of taxes made up 2% of all government spend.
- The consolidated fund, largely paying for the civil list and key government positions, amounted to 1%, leaving 16% of spend for 'voted' spending.
- As this was prior to any functioning welfare state or National Health System, the largest single cost in this voted spending was public education, at 8% of all UK spending.
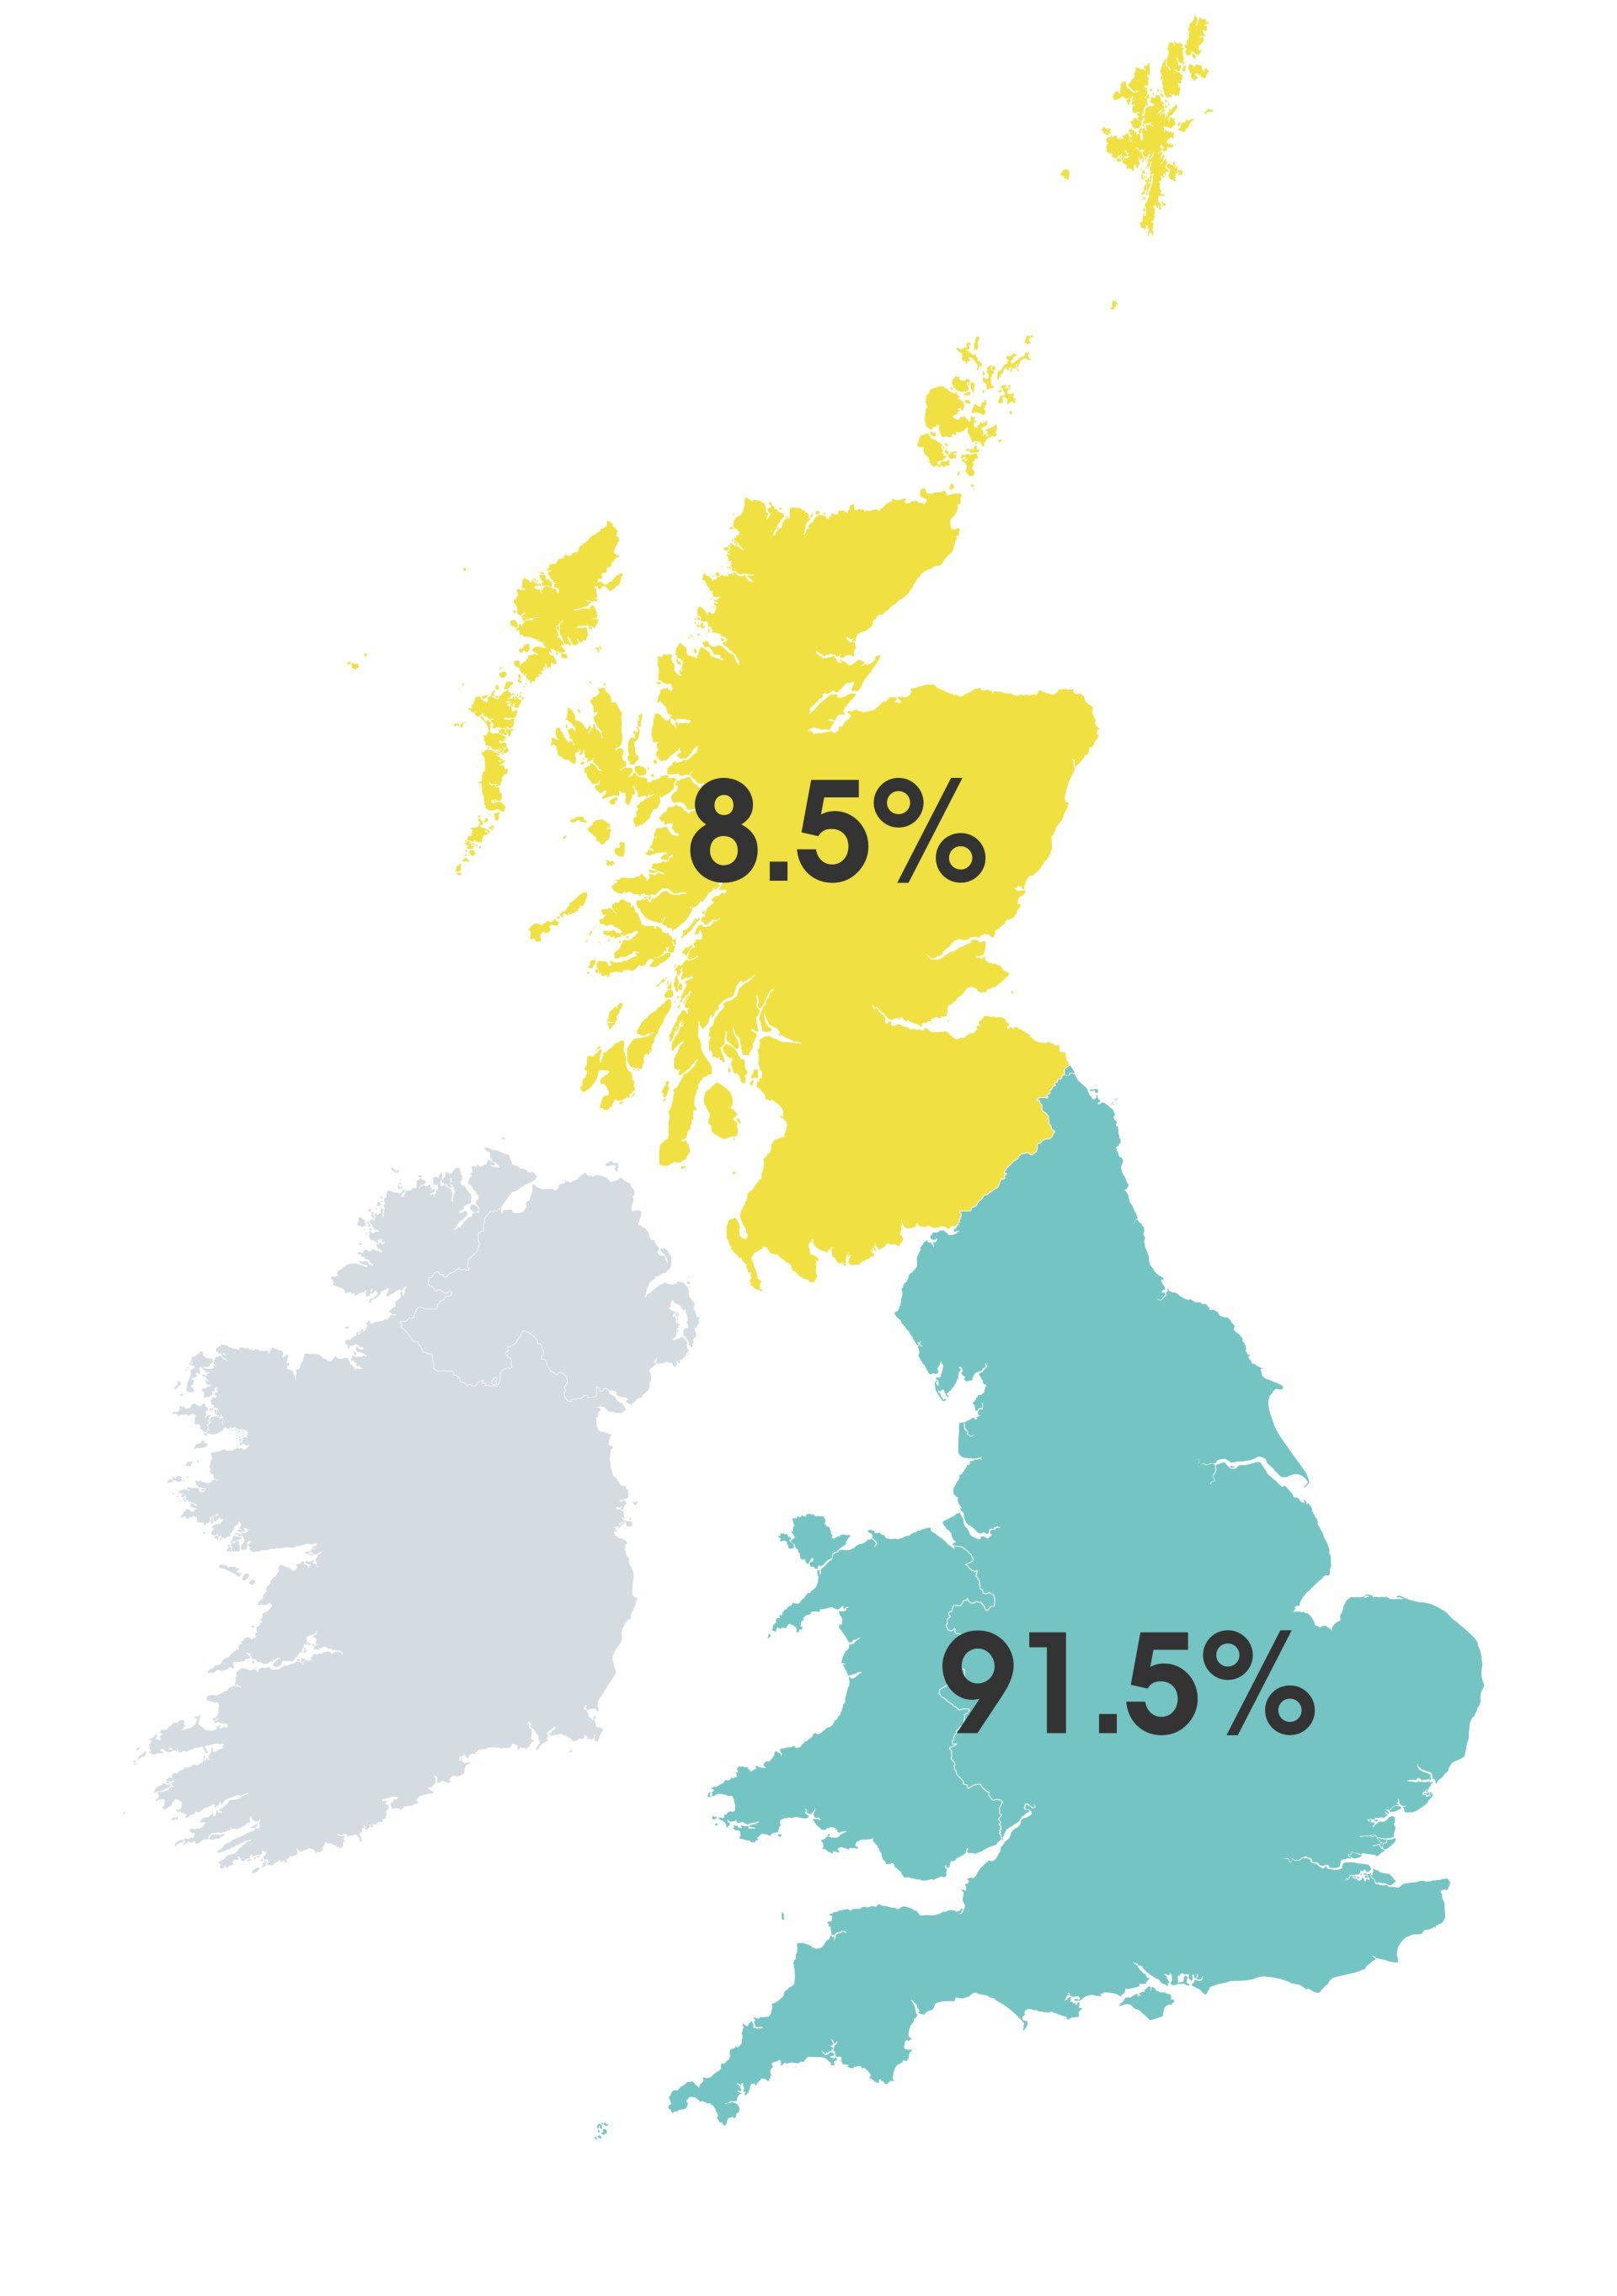
IDENTIFIABLE EXPENDITURE
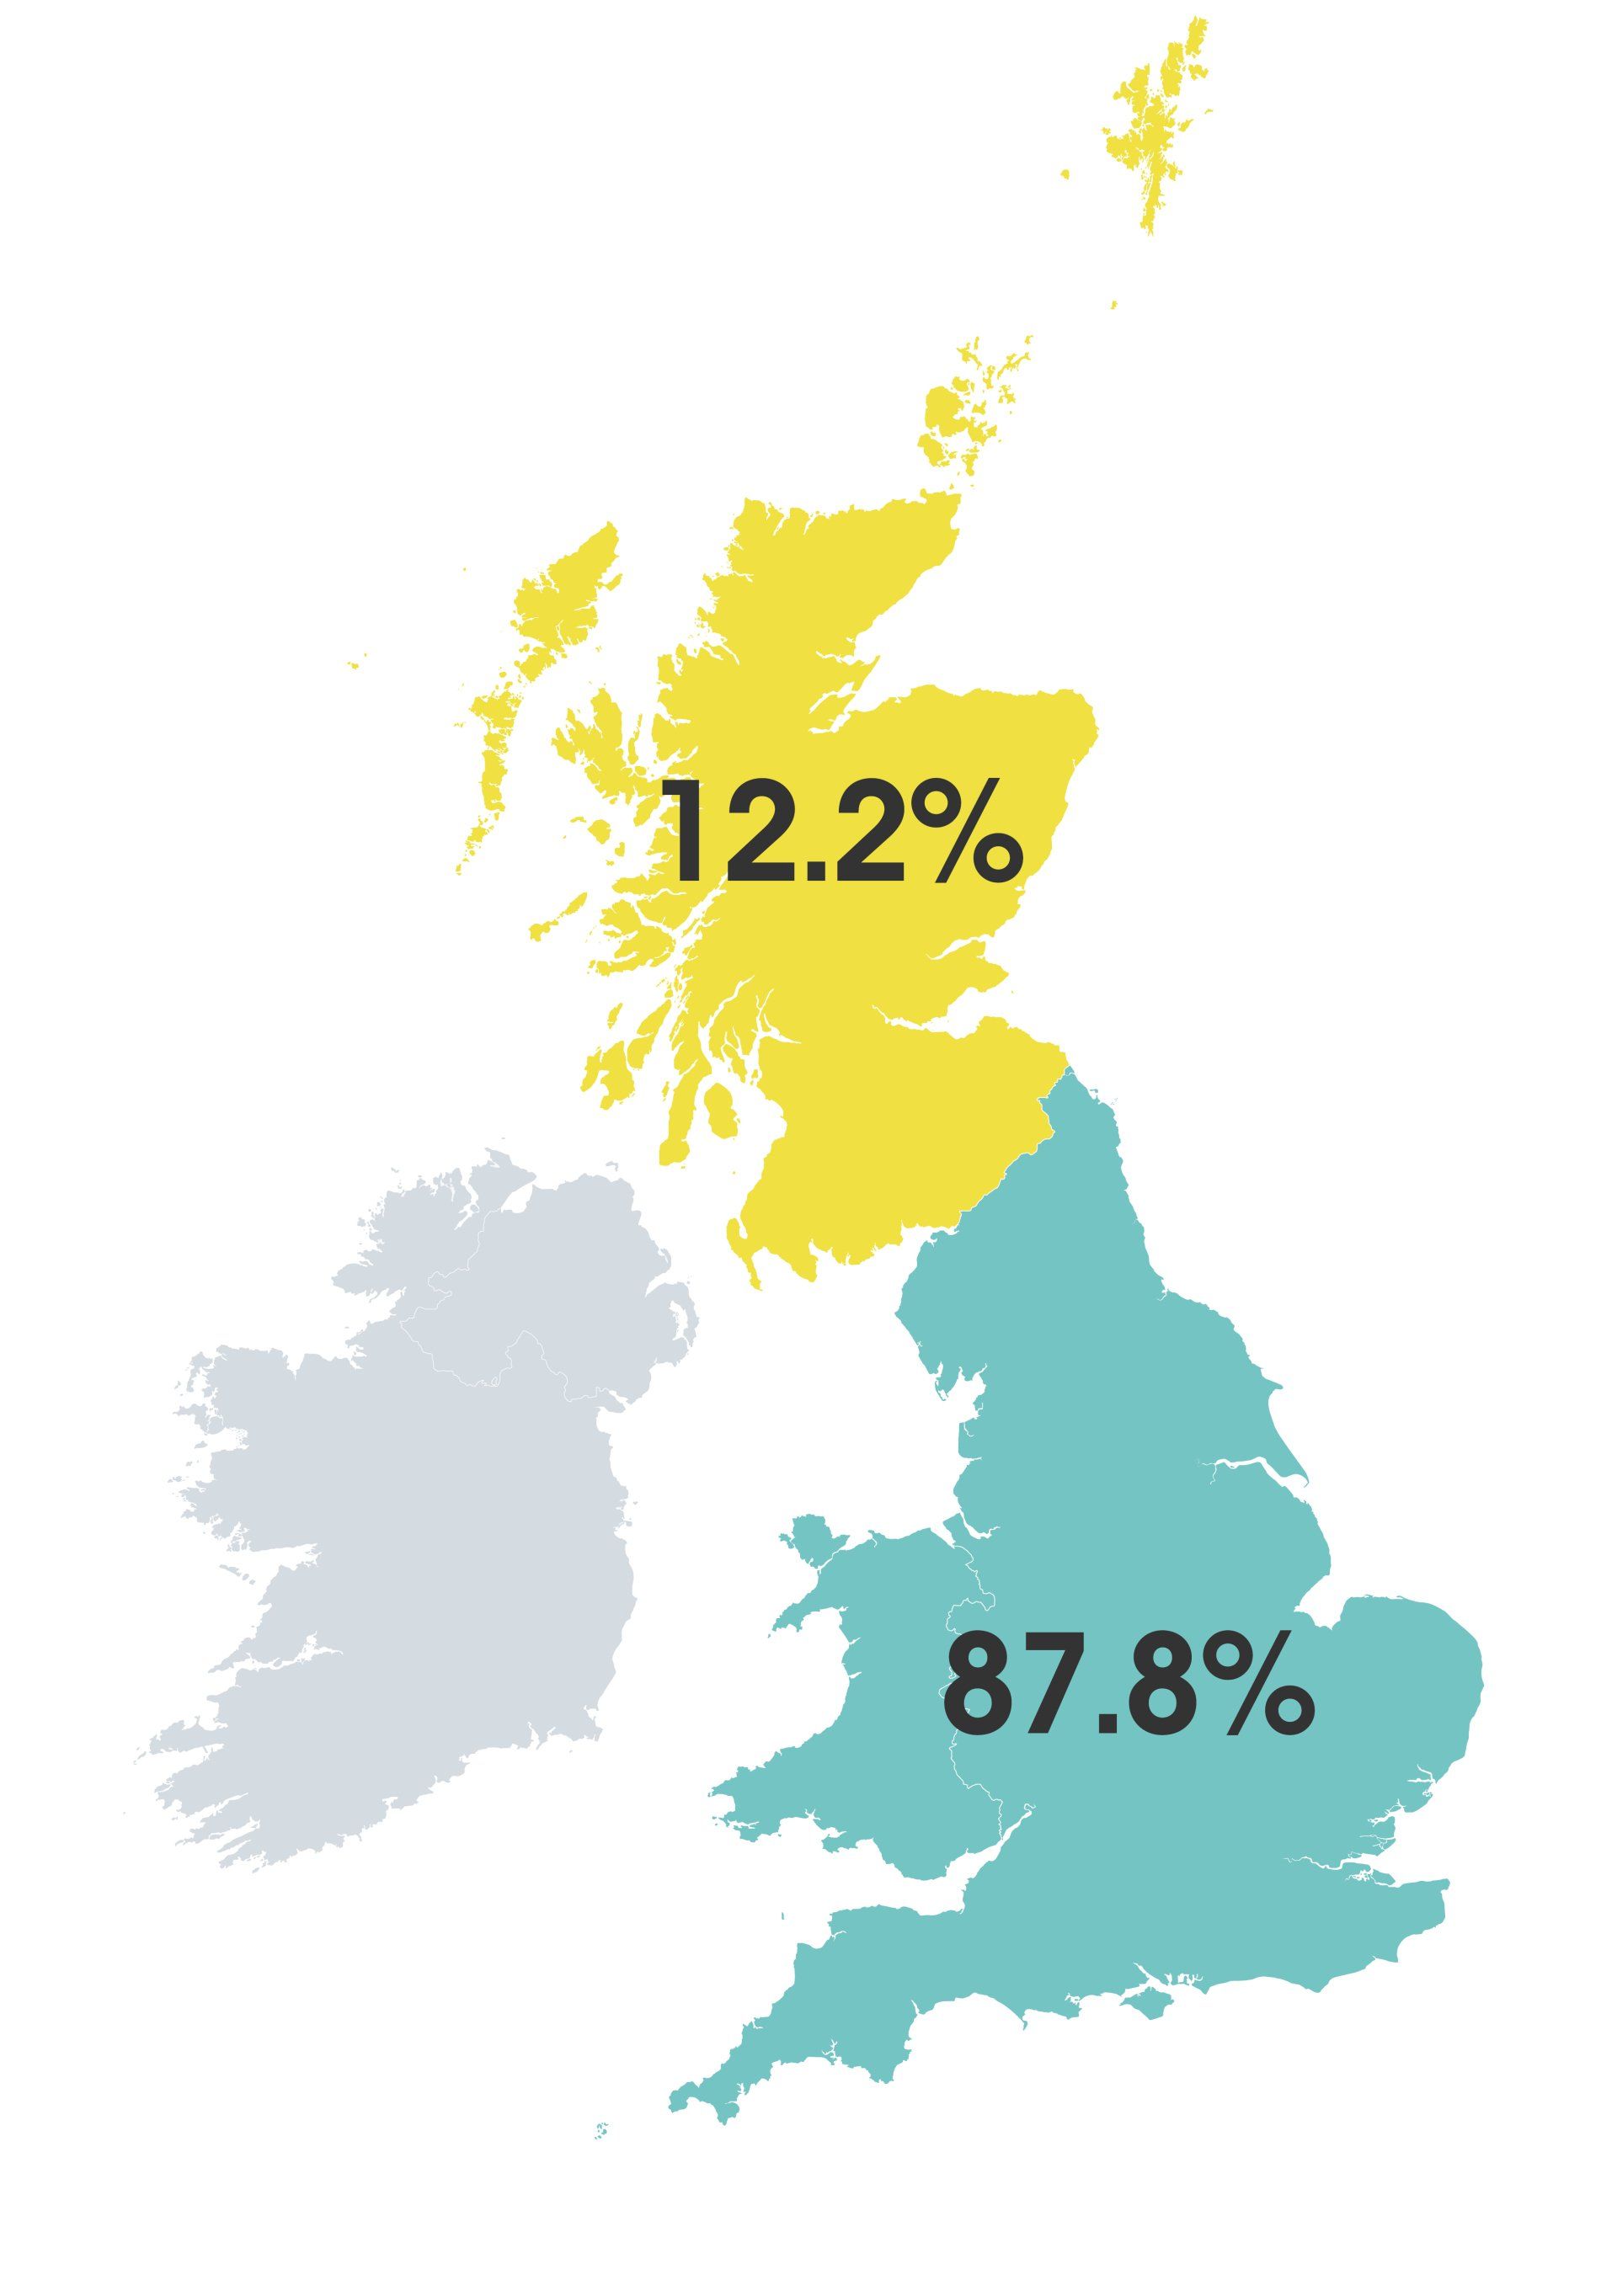
POPULATION FIGURES

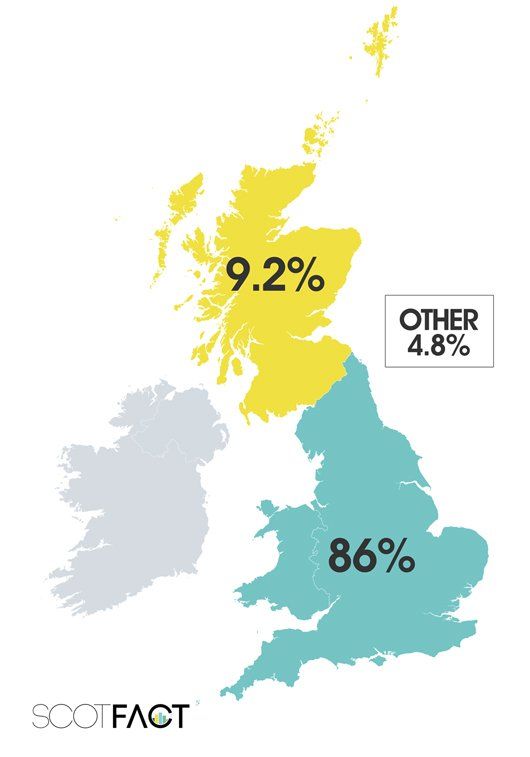

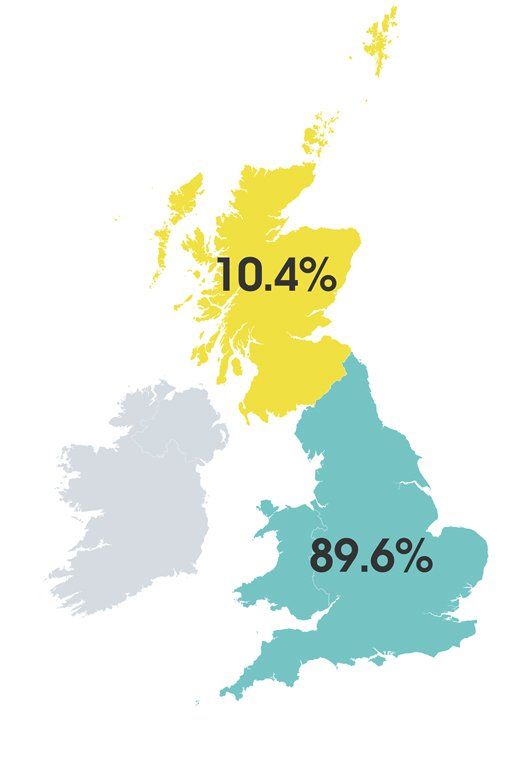
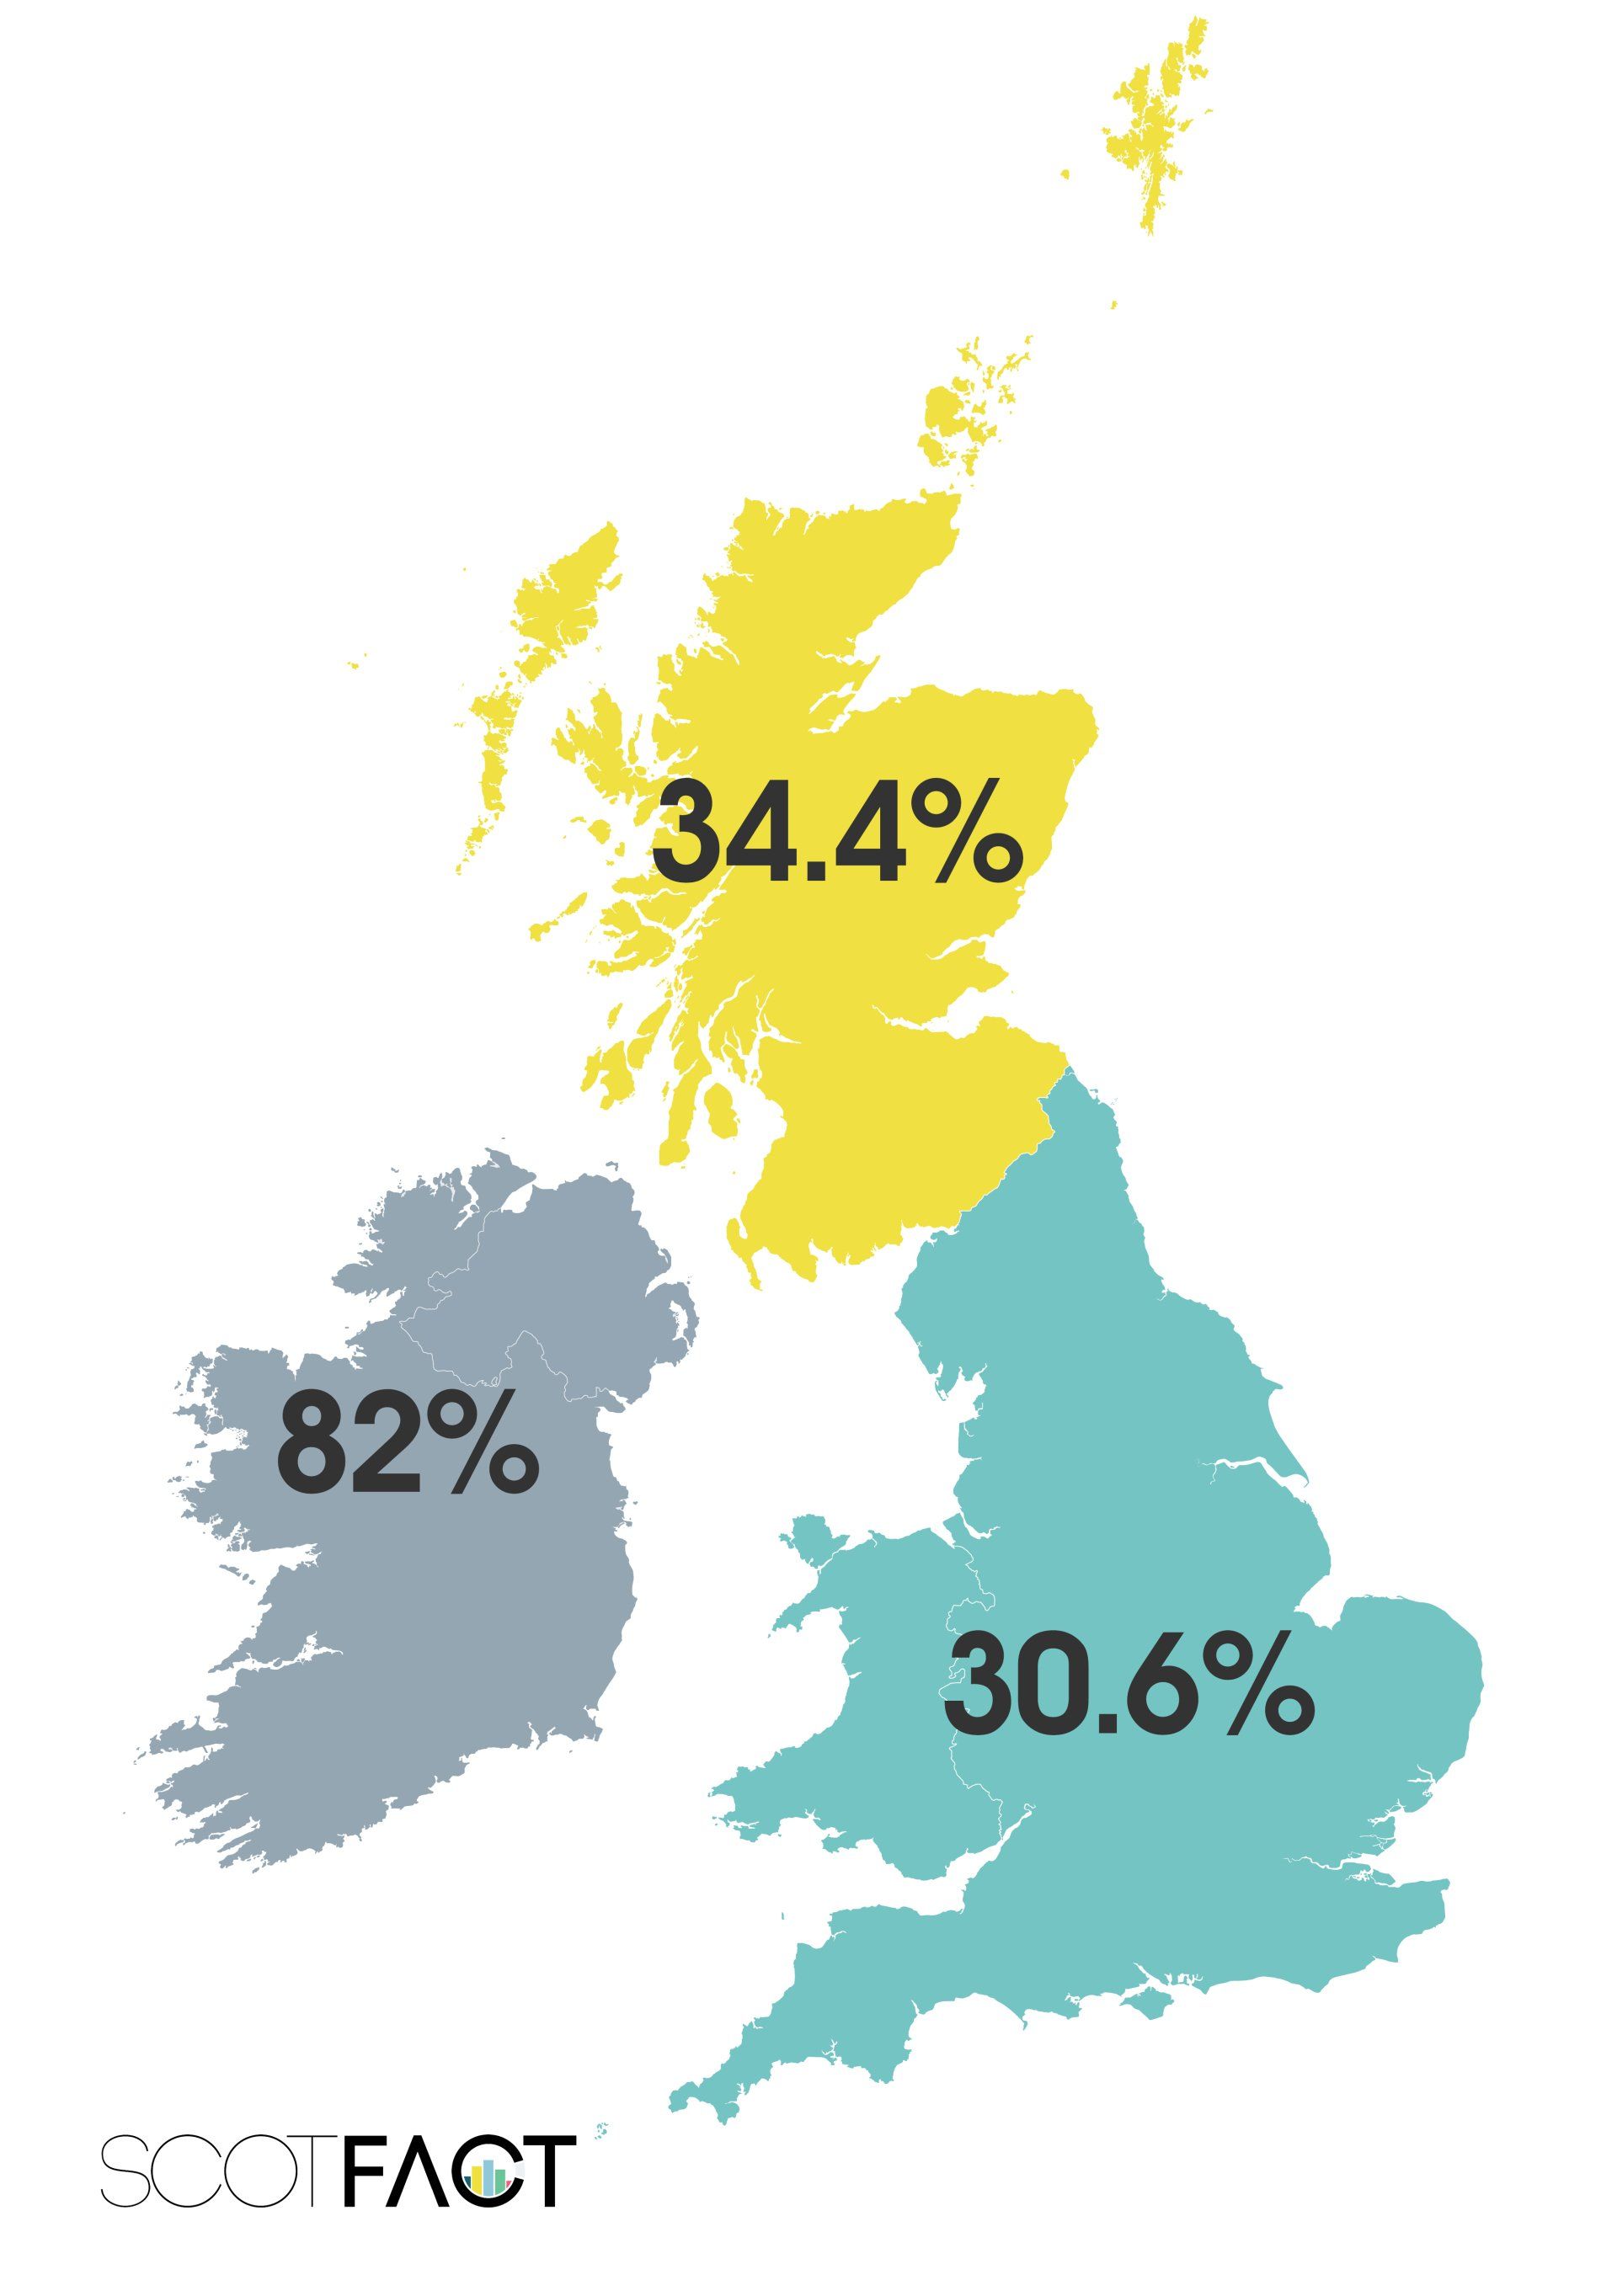
SHARE
[3] H.B. Peebles. Warship Building on the Clyde, 1987, John Donald Publishers Ltd. ISBN 10: 0859761932
[4] Scottish Financial and Trade Statistics, (Report of the Catto Committee), Cmd 8609
[6] Government Expenditure Revenue Scotland Historical
- 1899-1900, 1900 paper 336
- 1900-1901, 1901 paper 182
- 1901-1902, 1902 paper 256
- 1902-1903, 1903 paper 248
- 1903-1904, 1904 paper 225
- 1904-1905, 1905 paper 230
- 1905-1906, 1906 paper 278
- 1906-1907, 1907 paper 245
- 1907-1908, 1908 paper 216
- 1908-1909, 1909 paper 208
- 1909-1910, 1910 paper 233
- 1910-1911, 1911 paper 220
- 1911-1912, 1912 paper 190
- 1912-1913, 1913 paper 200
- 1913-1914, 1914 paper 387
- 1914-1915, 1915 paper 309
- 1915-1916, 1916 paper 119
- 1916-1917, 1917 paper 134
- 1917-1918, 1918 paper 106
- 1918-1919, 1919 paper 163
- 1919-1920, 1920 paper 245
- 1920-1921, 1921 paper 207
- 1931-1932, 1932 paper 5
- 1934-1935, 1935 paper 5010
- 1952-1953, 1953 paper 9051